-
Market Perspectives
May There Be Hope
May 2025
- Filename
- Market Perspectives MAY 2025.pdf
- Format
- application/pdf

TRANSCRIPT
We survived a “roller-coaster” April, and in hindsight, of course we did. However, recall how many felt during some of the more stressful moments during April. That 15% drop from April 2 to intraday April 7 had more than a few nervous. From that intraday low, the S&P 500 is up approximately 22% as of filming.
For the month of April, the S&P 500 finished almost flat, just a little bit down – remarkable.
If you had checked the market on March 31, then gone to, let’s say, the Galapagos Islands – maybe the last place left where one doesn’t have cellular service, at least, in my experience – and then come back on April 30, and checked the markets, it would have been easy to think it had been a ho-hum month. But for those of us with cellular and constant internet service, it was far from that. But it is nice to see that holding steadfast again proved to be a wise strategy.
The Impact of Timing on Equity Returns
Value of $1M Invested in the S&P 500 (Jan. 2003 - March 2025)
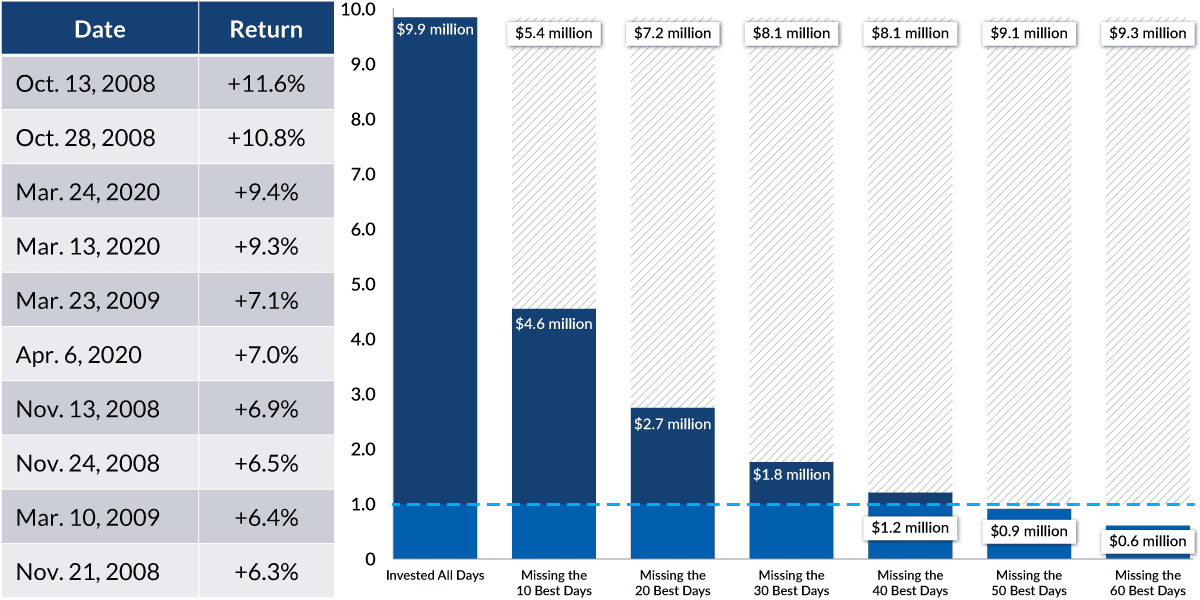
Data current as of April 3, 2025.
Sources: JP Morgan, S&P 500 index total returns from January 1, 2003 to March 25, 2025
Information is subject to change and is not a guarantee of future results.
Chart 1, 1:09— Recall this chart from last month. We repeat it only because it is so important, and too often counterintuitive. Moving to the sidelines until "things settle down" is not a successful strategy. Recall that we pointed out that most of the strong, quick moves up come during periods of volatility and concern. Now, none of the days in April will make the top 10 list here, but that 22% move from the intraday low is significant.
S&P 500
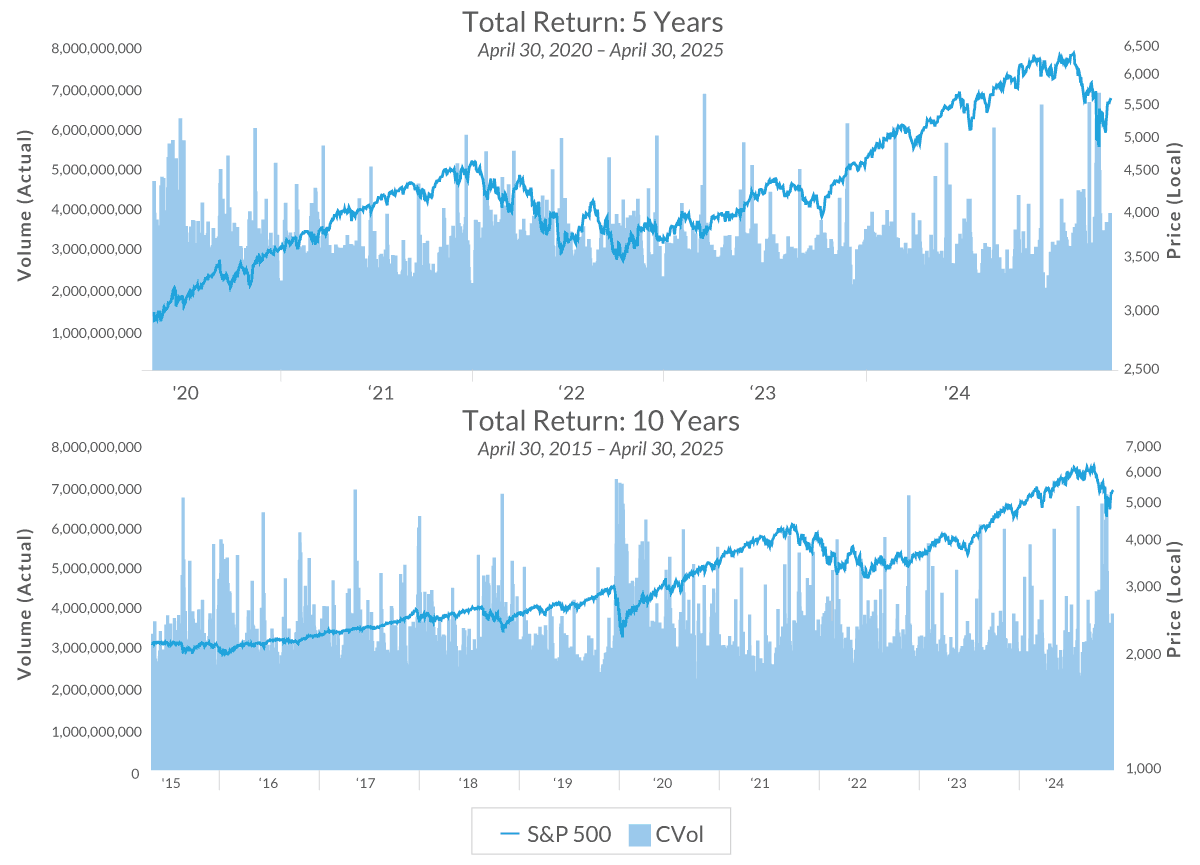
Data current as of April 30, 2025.
Source: Factset
Past performance is not a guarantee of future returns.
Chart 2, 1:38— You’ve heard us state often that time is your ally when investing in risk assets, like stocks.
Looking at the two S&P charts here, one measuring a rolling 5-year return, the other a 10-year as of April 30, what jumps out is, of course, the 106% cumulative return over a 5-year period, and the 219% cumulative return over the 10-year period.
We’ll take it, right? But there were periods where reducing risk felt like the right thing to do, even during these periods.
After all, we experienced a 9% drop in late 2018, the frightening 33% drop in the first quarter of 2020, 2022’s 18% contraction, the 10% drop in mid-2023 and the nearly 10% pullback in August last year. So, our resolve was tested many times over these successful time periods. Anyway, some perspective as we navigate the current environment together.
Now, don’t go telling everyone that Charles claims it’s all “rainbows, unicorns and free chocolate chip cookies” – there’s plenty of potential worry out there still.
Here’s where we are, and what we’re watching. The tariff picture has improved considerably since Liberation Day. Recently announced deals with the U.K. and China have been well received.
China and the U.S. agreed to create a mechanism for further talks led by U.S. Treasury secretary Scott Bessent. The de-escalating tone is very welcomed. However, this is still an evolving situation with ample opportunity for further disruption, and there are other deals that need to be reached.
The geopolitical picture added another concern as India and Pakistan rekindled their long-running conflict. A ceasefire between the two nuclear-armed powers appears to be holding for now.
U.S. corporate earnings continue to grow in the low double digits – that’s good news. And a slew of economic data is due over the next few days, and we will be closely watching for any signs that the recent distress has negatively impacted the U.S. economy, and by how much.
For now, may there be hope that the recent relatively positive developments stick.
Important Information
The views expressed represent the opinions of City National Rochdale, LLC (CNR) which are subject to change and are not intended as a forecast or guarantee of future results. Stated information is provided for informational purposes only, and should not be perceived as personalized investment, financial, legal or tax advice or a recommendation for any security. It is derived from proprietary and non-proprietary sources which have not been independently verified for accuracy or completeness.
While CNR believes the information to be accurate and reliable, we do not claim or have responsibility for its completeness, accuracy, or reliability. Statements of future expectations, estimates, projections, and other forward-looking statements are based on available information and management's view as of the time of these statements. Accordingly, such statements are inherently speculative as they are based on assumptions which may involve known and unknown risks and uncertainties. Actual results, performance or events may differ materially from those expressed or implied in such statements.
Past performance or performance based upon assumptions is no guarantee of future results.
All investing is subject to risk, including the possible loss of the money you invest. As with any investment strategy, there is no guarantee that investment objectives will be met and investors may lose money. Diversification does not ensure a profit or protect against a loss in a declining market.
Equity investing strategies & products. There are inherent risks with equity investing. These risks include, but are not limited to stock market, manager or investment style. Stock markets tend to move in cycles, with periods of rising prices and periods of falling prices.
Fixed Income investing strategies & products. There are inherent risks with fixed income investing. These risks include, but are not limited to, interest rate, call, credit, market, inflation, government policy, liquidity or junk bond risks. When interest rates rise, bond prices fall. This risk is heightened with investments in longer-duration fixed income securities and during periods when prevailing interest rates are low or negative.
City National Rochdale, LLC is an SEC-registered investment adviser and wholly-owned subsidiary of City National Bank. Registration as an investment adviser does not imply any level of skill or expertise. City National Bank is a subsidiary of the Royal Bank of Canada.
© 2025 City National Rochdale, LLC. All rights reserved.
Index Definitions
The Standard and Poor’s 500 Index (S&P 500) is a market capitalization-weighted index of 500 common stocks chosen for market size, liquidity, and industry group representation to represent U.S. equity performance.
FactSet is a financial data and software company that provides computer-based financial data and analysis for professionals in the finance industry, including investment managers, hedge funds, and investment bankers. It consolidates data on global markets, public and private companies, and equity and fixed-income portfolios.
Stay Informed.
Get our Insights delivered straight to your inbox.

Put our insights to work for you.
If you have a client with more than $1 million in investable assets and want to find out about the benefits of our intelligently personalized portfolio management, speak with an investment consultant near you today.
If you’re a high-net-worth client who's interested in adding an experienced investment manager to your financial team, learn more about working with us here.